Data visualization/Tableau
The goal of data visualization is to communicate information clearly and effectively through graphical means. It doesn’t mean that data visualization needs to look boring to be functional or extremely sophisticated to look beautiful.
Data visualization allows anyone to organize and present information intuitively. This is becoming more vital as data proliferates in every field from bar codes in retail stores to player behavior in online games. All of this data is meaningless without a way to organize and present important findings within it.
To convey ideas effectively, both aesthetic form and functionality need to go hand in hand, providing insights into a rather sparse and complex data set by communicating its key-aspects in a more intuitive way.
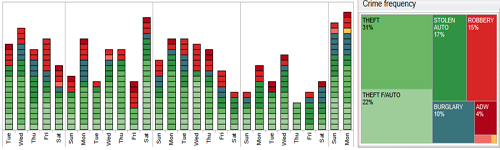
The above visualization shows weekely Crime frequency. It uses different color palettes to show Theft, Stolen Auto, Robbery, Theft F/Auto, Burglary and Adw. It also shows day wise to evaluate two measures at once.
Tableau has invested years in designing a product with built-in data visualization best practices. You won’t find flashing traffic lights (one of the “bad” ways to show data), but you will powerful tools that help you make sense of data and communicate your findings to others.
Data visualization scope
There are different approaches on the scope of data visualization. One common focus is on information presentation for
Articles and resources
Displaying data and news
Displaying connections